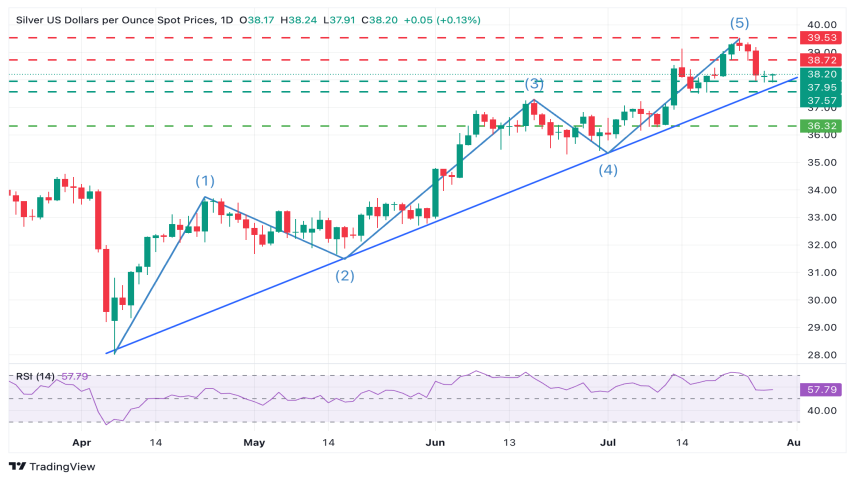
The silver market (XAG/USD) is showing signs of short-term weakness following an aggressive rally from April lows. After peaking near $39.20, price action has turned corrective, a move that was clearly anticipated by bearish divergence on the 4-hour chart — and later confirmed by Friday’s sharp bearish impulse.
As of now, Silver is consolidating slightly above $38.00, the July 29 intraday low, but downside pressure remains evident. The RSI on the 4-hour timeframe is hovering close to oversold territory, yet not fully exhausted, indicating that the current dip still has room to extend — especially with the US Dollar maintaining upside momentum.
🔻 Key Technical Levels to Watch:
• Trendline Support: $37.85 – Mid-term ascending trendline from April lows
• Horizontal Support: $37.55 – July 15–17 support zone
• Break Confirmation: A decisive break below this support cluster could validate a completed 5-wave bullish cycle (Elliott Wave) and signal the start of an A-B-C corrective phase.
🔼 Upside Barriers:
• Immediate resistance at $38.35 (Monday’s high)
• Followed by $38.75 (July 24 low) and $39.55 – a critical level where sellers previously re-emerged.
⚠️ High Volatility = High Opportunity
Silver is entering a key decision zone. Whether we bounce or break, highly profitable scalping opportunities are unfolding — and our premium subscribers will receive these setups in real-time.
📉 If you're still relying on delayed signals or public posts, you're already behind.
📲 Unlock access to real-time, AI-powered signals and in-depth market forecasts now.
🟢 Stay Ahead. Stay Profitable.
Join Gold Scalping Signals Premium today — and stop missing out on these high-accuracy trades.