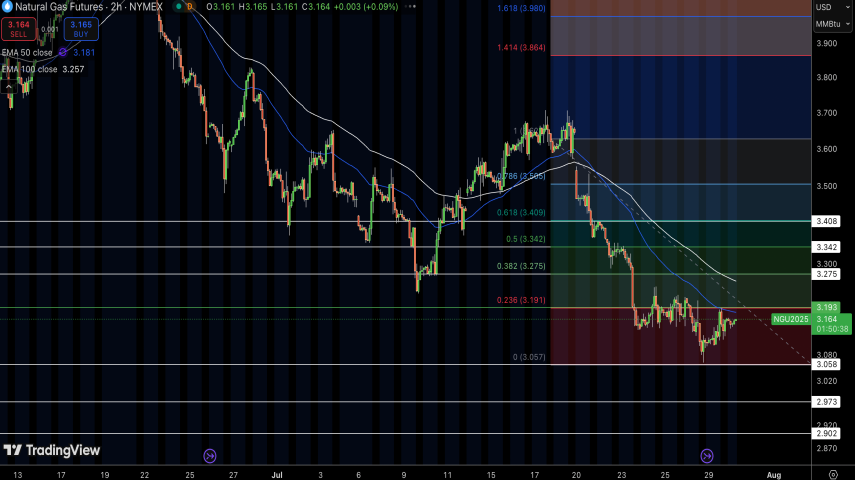
Natural Gas is currently stabilizing near the $3.058 demand base after recent downside pressure. While price has found temporary support, the broader structure remains bearish.
Price continues to trade below the descending trendline, as well as under the 50 EMA ($3.181) and 100 EMA ($3.257) on the daily chart — confirming sellers are still in control.
🔍 Key Technical Levels (GoldScalping Breakdown)
🔼 Resistance Zones:
$3.191 – 23.6% Fib retracement
$3.275 – 38.2% Fib + trendline confluence
$3.342 – Key breakout level (50% Fib)
🔽 Support Zones:
$3.080 – Minor reaction level
$3.057 – Local base support
Deeper downside targets: $2.973 and $2.902
🧠 GoldScalping Signals Commentary
To flip bias to bullish, buyers must reclaim $3.275 and close strongly above $3.342 — only then would we target upper resistance at $3.408 and possibly $3.585.
For now, structure shows:
Lower highs
Rejection at Fibonacci confluence
Weak momentum confirmed by low volume
We remain cautious on longs unless volume confirms breakout. Otherwise, we continue favoring sell setups near resistance zones with tight risk control.
📍 GoldScalping Signals | We Track More Than Gold – Natural Gas, Crude, and Beyond.