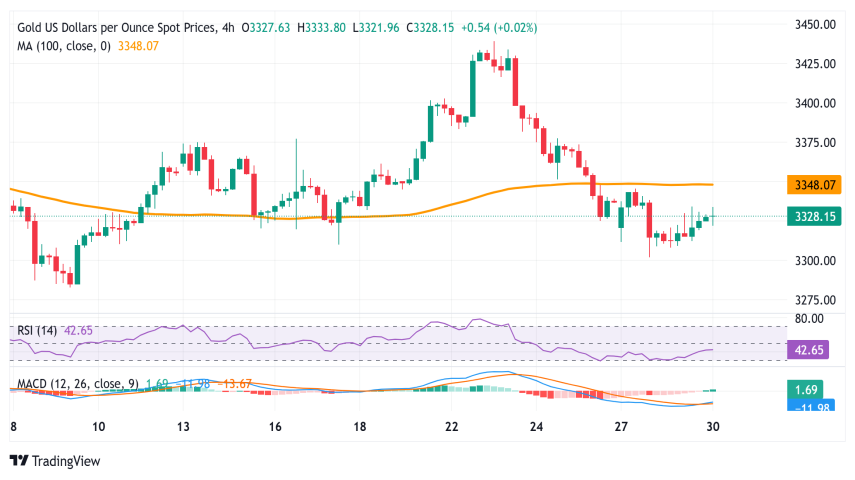
Gold (XAU/USD) attempted a rebound from the $3,300 zone — a level not seen in nearly three weeks — but the upside remains technically capped as long as prices stay beneath a crucial resistance: the 100-SMA on the 4-hour chart (currently near $3,345).
📉 Bearish Signals Still Dominate
Price recently broke below the 100-SMA on H4, turning it from support into resistance.
Momentum indicators on the same chart (MACD, RSI) remain bearish, suggesting that rallies may continue to be sold.
If Gold closes firmly below the $3,300 handle, expect further downside towards the $3,260–$3,255 zone — in line with the 100-day SMA.
📈 Key Bullish Scenario?
A clean breakout above $3,345 would challenge the $3,367–$3,368 short-term resistance.
Sustained strength above that region may spark short-covering, with upside targets at:
🔸 $3,400 (psychological round number)
🔸 $3,434–$3,435 (key structure zone)
🔸 $3,500 (April’s record high & major breakout trigger)
However, unless bulls reclaim $3,345 with conviction, the path of least resistance remains to the downside.
🔐 Premium Take from Gold Scalping Signals:
🚨 Join VIP now and receive instant alerts on such scalping entries with defined risk and high probability setups.